Chapter 1 Lab 1
In this lab we will be introduced to the skills we will develop over the next year and beyond. This lab will introduce open science and why it is relevant to your development as a Psychologist. We will meet our groups and the staff that will be leading our labs and who we will get to know well over these two semesters. We can’t wait to get started!
1.1 Pre-class activity
Watch this video of Dr Simine Vazire talking about open science and why it is an important concept for us to understand in Psychology.
Intro to open science
1.2 In-class activities
We want to give students more context about the importance of taking an open and replicable position with their research so we provide a simple drawing task where each of them has to follow the instructions below. The output is varied as prevoius staff attempts show! This activity is included in lab 1 so students have not yet been introduced to R but rather are learning abdout the issues and current debates in the field.
1.2.1 Activity 1: Replication task
In your groups please complete these steps on a bit of paper.
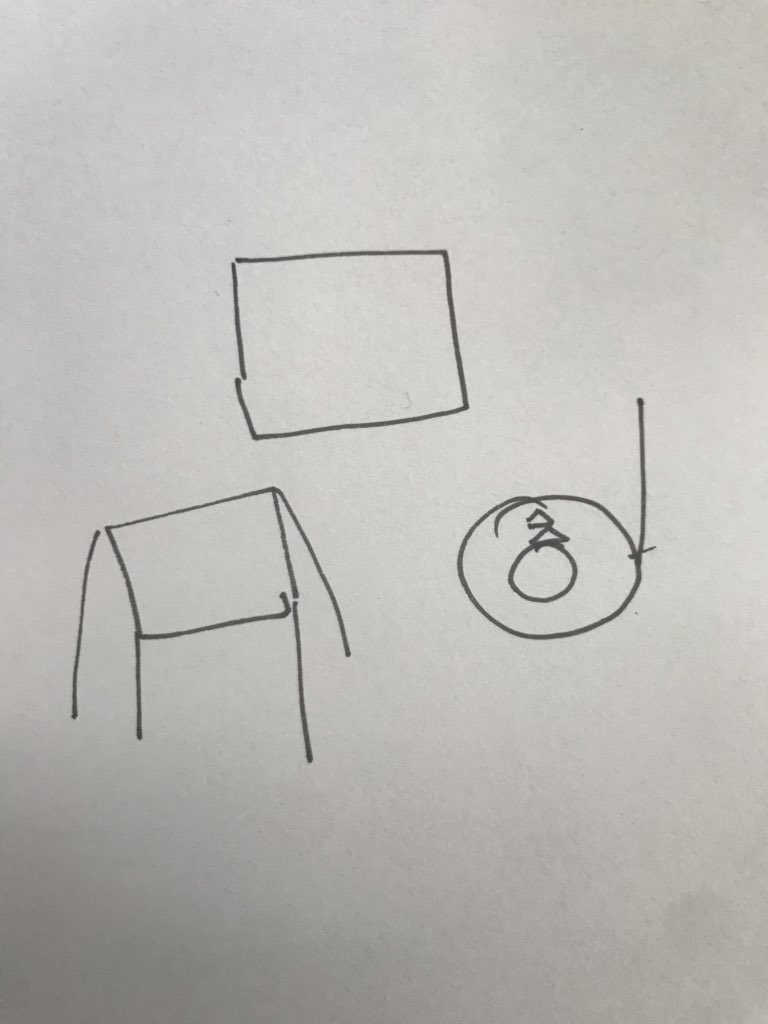
*Draw a square
*Draw another square at 15 degree angle to the bottom of the 1st square
*Draw 4 lines down from each corner of the 2nd square
*Draw a circle next to 2nd square
*Draw a smaller circle on top of first circle
*Draw upward line from side of 1st circle
*Draw 2 triangles on top of 2nd circle
Two examples of different interpretations of this task:

1.2.2 Activity 2: Getting to know the data
This semester we will use the same dataset each week to develop our skills and knowledge. The dataset is from Woodworth et al. (2018) details of which can be found here Web-based Positive Psychology Interventions: A Reexamination of Effectiveness.
Familiarise yourself with the data and the study it comes from. What are the variables? Can you think of a research question that you would be interested in answering with this data?
Post class activity This is a formative task where the students have to familiarise themselves with the data and develop a research question relative to that data specifically whilst thinking through what they would need the data to look like before analysing. For example, they may look at the data and be interested in seeing there was an effect of intervention type on happiness score so, in their groups, they would start to think about how they could wrangle their data to make it suitable for an appropriate analysis. Our thinking behind this was that by understanding the problem students will understand the need for an effective tool to help them. Although RStudio has not been introduced to them yet, open science and replicability has. We are presenting the challenge of big, messy real data before we present the tool that can meet this challenge - R.
1.3 Additional resources around open science and replicability
Is most published research wrong?
Replicability and Reproducibility Debate with Professor Dorothy Bishop