Chapter 6 Lab 6
This lab builds on the skills developed to date by using pipes to join lines of previously used tidyverse verbs. The pre-class activity for this lab is to revisit previous in-class activities, assessments and feedback to recap skills developed to date.
6.1 Inclass activities
6.1.1 Activity 1: library
We are going to be working with the Autism Quotient (AQ) data which you have already been introduced to in lab 5 and in the pre-class for this lab. The relevant data required to use this data comes in 3 separate files; the survey responses ‘responses.csv’, the question formats ‘qformats.csv’ and scoring info ‘scoring.csv’. To get us started, load in tidyverse.
6.1.2 Activity 2 : read_csv
Read in the data to create the objects responses, qformats and scoring using the corresponding data files for each tibble i.e. responses for the response data, qformats for the question formats and scoring for the scoring info.
responses <- read_csv("files/responses.csv")
qformats <- read_csv("files/qformats.csv")
scoring <- read_csv("files/scoring.csv")
Checkpoint Has the data now appeared in the environment? Take a look and make sure each objects looks as you would expect it to. Does the data look the same as it did in the .csv files? Is it in the format ideal for analysis (see lab 1 in-class and lab 2 prep for a clue)?
6.1.3 Activity 3: gather
Let’s get this data into long format from wide format.Firstly, create rlong by using gather to show the question and response for each participant in long format (if you’re struggling to understand gather, see lab 5 for more explanation about what each argument is doing).
6.1.4 Activity 4: inner_join (QFormat)
Now use inner_join to add in the question format (QFormat) for each question and store it in rlong2. This should now have 4 columns showing Id, Question, Response and QFormat.
## # A tibble: 6 x 4
##      Id Question Response            QFormat
##   <dbl> <chr>    <chr>               <chr>
## 1    16 Q1       Slightly Disagree   F
## 2    17 Q1       Definitely Agree    F
## 3    18 Q1       Definitely Agree    F
## 4    19 Q1       Definitely Agree    F
## 5    20 Q1       Definitely Disagree F
## 6    21 Q1       Slightly Disagree   F
6.1.5 Activity 5: inner_joint (scores)
We can now get the score for each participant for each question. Use inner_join to add in the score for each question and store it in rscores.
## # A tibble: 6 x 5
##      Id Question Response            QFormat Score
##   <dbl> <chr>    <chr>               <chr>   <dbl>
## 1    16 Q1       Slightly Disagree   F           0
## 2    17 Q1       Definitely Agree    F           1
## 3    18 Q1       Definitely Agree    F           1
## 4    19 Q1       Definitely Agree    F           1
## 5    20 Q1       Definitely Disagree F           0
## 6    21 Q1       Slightly Disagree   F           0
6.1.6 Activity 6 - group_by
To calculate the AQ score for each participant, firstly we need to group the scores by Id. Using the tibble rscores defined in task 5, group the AQ scores by Id and store it in aq_scores1.
6.1.7 Activity 7: summarise
Now we have the scores grouped by Id, we can use summarise to calculate the sum of each question’s score for each participant. Do this for aq_scores1 and store it in aq_scores2.
## # A tibble: 6 x 2
##      Id    AQ
##   <dbl> <dbl>
## 1    16     4
## 2    17     2
## 3    18     3
## 4    19     1
## 5    20     2
## 6    21     2
6.1.8 Actvity 8: pipes
There is a more efficient way of calculating the AQ scores for each participant by combining the lines of code in tasks 6, 7 and 8 together into one tibble using pipes. Using the tibble rscores defined in task 5, calculate AQ scores for each participant. Name this table aq_scores (USE THIS EXACT NAME!)
Checkpoint Does aq_scores look the same as aq-scores2?
Pipes can be a little confusing at first - one way to make it easier to understand what your code is doing is to translate your code to full sentences. You should pronounce %>% as then. For example, you might read the the above code chunk as "take the data in the object rscores, then group it by Id, and then sum up the total Score.
6.1.9 Activity 9: ggplot
Finally, show the distribution of the overall AQ scores by producing a histogram from aq_scores.
## TODO: uncomment the following line, and replace it with your answer:
ggplot(aq_scores, aes(AQ)) +
  geom_histogram()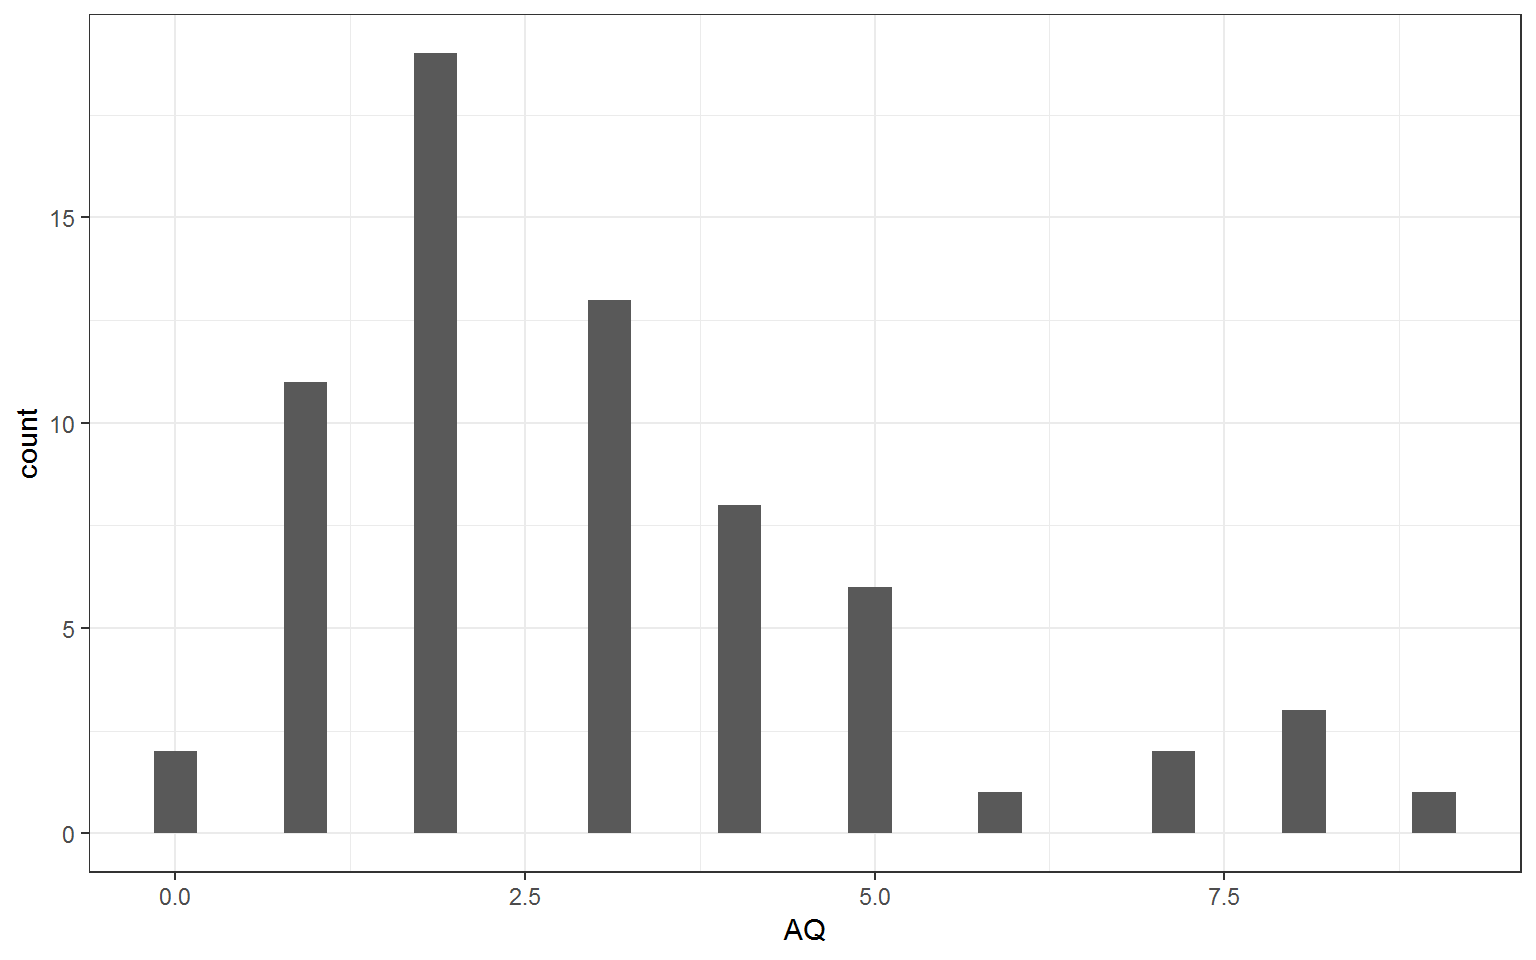
Figure 6.1: Autism Quotient Score distribution.
Well done! You should use this activity to help you complete the assessment to be submitted 1 week from your lab by 12pm.